
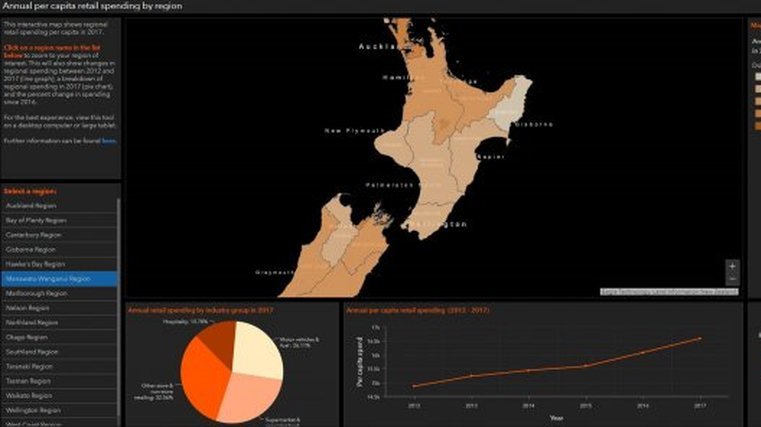
Interactive map offers insights into motor vehicle spending
In 2017, New Zealanders and visitors spent $92 billion at retail businesses within New Zealand, 6.8 percent ($6 billion) more than in 2016. Unsurprisingly, most of these sales were in those regions with the highest populations. Auckland, with its 1.7 million inhabitants, recorded $33 billion in sales in 2017, while the West Coast (population about 33,000) had just $0.6 billion in sales.
However, when we look at regional sales on a per capita basis, some interesting patterns emerge.
The interactive map shows the annual per capita sales value for each of New Zealand’s 16 regions. It also shows how sales within a region are split between the four major retail groupings:
- motor vehicles, parts, and fuel retailing
- supermarket and specialised food retailing
- accommodation and food services
- other retailing (including non-store retailing such as catalogue and online retailers).
Per capita spending in a given region is influenced by factors like the median income of its residents, the strength of its local tourism industry, and the presence of non-store-based retail businesses (which are more likely to sell to shoppers outside their region as well as locals).
Regions with lower per capita retail spending tend to have lower median incomes, and a higher proportion of their retail spending goes to supermarkets and specialised food retailers, such as butcheries, delis, and liquor stores. Regions with higher per capita retail spend tend to have higher average incomes, and a greater proportion of their retail sales are from the accommodation and food services industry group, largely driven by tourists.