
Drivers bumping up household emissions
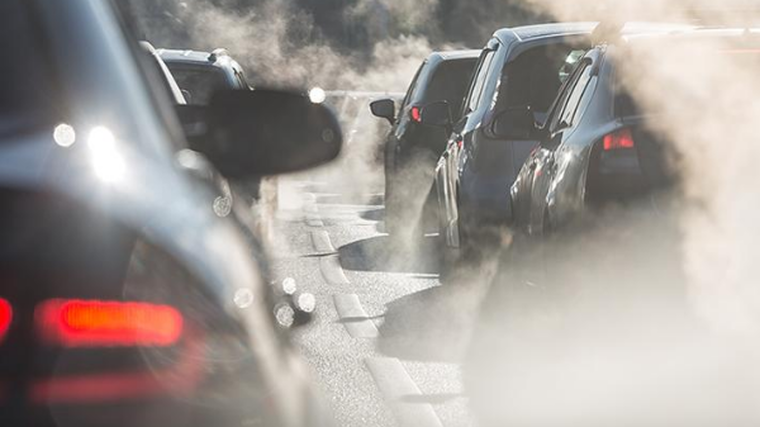
Fast-growing populations in parts of the North Island are being blamed for a surge in household emissions for those regions, with pollution from cars one of the main contributors.
Auckland, Waikato and Bay of Plenty had the biggest increases in household emissions, which includes emissions from vehicles, between 2007 and 2018, according to the latest figures from Stats NZ.
In Auckland, the amount of carbon dioxide (CO2) and other gases pumped into the atmosphere from households increased 18 per cent, or 511 kilotonnes (kt), over the 11 years studied.
“The rise in Auckland’s household emissions is largely due to its growing population, leading to increased car emissions, and increased fuel use,” says Stephen Oakley, environmental-economic accounts manager at Stats NZ.
Meanwhile, Waikato’s went up by 24 per cent, or 211kt, and Bay of Plenty’s 22 per cent, or 112kt.
Only Gisborne, Taranaki, Marlborough, West Coast and Southland saw household emissions decrease.

Little change in decade
Overall, there was a reduction of just over one per cent in New Zealand’s total greenhouse gas emissions between 2007 and 2018.
Eleven regions recorded decreases in total greenhouse gas emissions, while four saw increases during the same period. Changes to a region’s total emissions occur as a result of increases or decreases in emissions from industry and households.
“While some regions reduced their emissions, this was largely offset by increased emissions in other regions,” Oakley explains.
“Industrial emissions, from either primary industries, goods-producing industries, or service industries, can be affected by a number of factors, such as structural changes to the local economy, changes in technology, or efficiency gains.
“This is the first comprehensive picture we have been able to develop to show where emissions are being produced in New Zealand and which regions are driving the changes in emissions.”

Rises and falls
The largest falls in total emissions were in Auckland, which was down 955kt, or 7.8 per cent, Taranaki’s figures fell by 707kt, or 11.3 per cent, Northland was down 545kt, or 10.8 per cent, and Waikato recorded a drop of 272kt, or two per cent.
Over the same period, emissions increased in Canterbury by 1,175kt, or 11 per cent, Bay of Plenty was up 356kt, or 11.9 per cent, Southland’s figures climbed 335kt, or 6.2 per cent, and Otago was up 333kt, or seven per cent.
The decrease in Auckland’s emissions mainly came from the goods-producing industries, where emissions fell by 1,675kt, or 25 per cent.
This was attributed to decreases in emissions from the electricity, gas, water, and waste services industry. However, rising emissions from the services industries and household emissions offset some of those gains.
In Canterbury and Otago, increases in overall emissions were driven largely by the primary industries and especially the growing number of dairy cattle.
Bay of Plenty’s increase has been attributed to a combination of increasing household emissions and more emissions from goods-producing industries, particularly the electricity, gas, water, and waste services industry.
The climb in greenhouse gas emissions from Southland was largely driven by goods-producing industries, particularly manufacturing, and primary industries.
In 2018, Auckland, Waikato, and Canterbury combined accounted for 47 per cent of total emissions from the 15 regions.
The regions with the least emissions were Marlborough, Tasman/Nelson, West Coast, and Gisborne, which collectively accounted for 5.8 per cent of the total.

Regional influence
Auckland, which contributes the most of any region to national economic activity, was the third highest emitter of greenhouse gases in 2018, and Wellington, the region with the second highest economic activity, was the ninth highest emitter.
Waikato had the highest level of emissions, even though it had the fourth-largest level of economic activity.
“This demonstrates that regions with higher levels of economic activity don’t always have higher emissions,” Oakley says. “The new data allows regions to better understand the emissions intensity of their economies. It will also be of interest as regions look to reduce their emissions while managing economic outcomes, thereby transitioning to a lower-emissions economy.”
Canterbury had the third highest level of economic activity in 2018 and the second highest emissions, while Waikato had the fourth highest level of activity and the highest level of emissions.

Key facts
Between 2007 and 2018:
• Total regional industry emissions fell 1,950kt, or 2.8 per cent.
• Total regional household emissions rose 1,033kt, or 11.8 per cent.
• Total regional emissions fell 917kt, or 1.2 per cent.
The largest changes in household emissions in 2018 compared with 2007 were:
• Auckland, up 512kt, or 18 per cent.
• Waikato, up 211kt, or 24 per cent.
• Bay of Plenty, up 112kt, or 22 per cent.